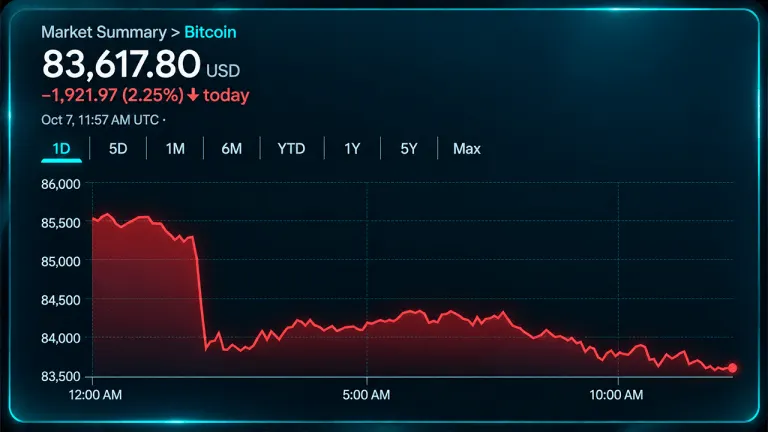
Bitcoin’s price range is trading near the floor of its 24-hour range after an overnight selloff dragged the BTC/USD pair to $83,404. The 1-hour picture is firmly bearish, with price below every listed moving average and the relative strength index (RSI) at 27, but the daily structure hasn’t completely cracked. Bulls now need to defend $83,404 and reclaim $84,350, while a deeper break puts the $81,950 daily pivot into focus.
Bitcoin’s price on the short-term chart took a hard hit on Wednesday as a high-volume overnight break erased the $85,500 area and pushed BTC to within striking distance of its 24-hour low.
At roughly $83,600, the market is caught in an interesting spot: the 1-hour setup is flashing strong sell conditions, and sellers remain firmly in the driver’s seat, yet the daily chart is still sitting above several important longer-term moving averages, leaving $83,404 as the immediate battleground between a relief bounce and another leg lower.
The 1-hour chart carries the ugliest tape. The 2 a.m. UTC candle opened at $85,525, plunged to $83,562, and closed at $83,829 per unit on 309 BTC of volume, far heavier than the 12-90 BTC seen during surrounding hours. Since then, hourly closes have remained below $84,350 while lower highs kept sellers in command.
The relative strength index (RSI) sits at 27, and the moving average convergence divergence (MACD) reads -532. Holding $83,404-$83,600 could invite a bounce, but reclaiming $84,000-$84,350 would offer much stronger evidence that buyers are actually returning.
The 4-hour chart tells much the same story with a little more weight behind it. The midnight-to-4 a.m. UTC candle opened at $85,544, dropped as low as $83,562 and finished at $84,121 while recording the heaviest 4-hour volume of the observed set.
The next candles couldn’t recover $84,350, and the latest move extended the session low to $83,404.49. A recovery through $84,200-$84,500 would improve the picture, while $85,500-$86,000 remains a tougher overhead zone. Below the session floor, attention shifts toward the $81,950 daily pivot.
The daily chart looks bruised rather than demolished. Wednesday’s developing candle opened at $85,544 and fell to $83,404, taking out the Oct. 6, Oct. 5 and Oct. 2 lows along the way.
Bitcoin’s price is below the 10-period exponential moving average (EMA) at $84,620 and the 20-period simple moving average (SMA) at $84,200, but it remains above the 20-period exponential moving average (EMA) at $83,520, the 30-period simple moving average (SMA) at $81,827 and the 50-period simple moving average (SMA) at $80,286. That leaves the broader trend wounded, but not yet broken.
On the daily reading via the oscillator set , the relative strength index (RSI) at 54, Stochastic at 52, commodity channel index (CCI) at 6, and average directional index (ADX) at 43 are all neutral.
Momentum at -824 and moving average convergence divergence (MACD) at 1,717 carry bearish readings. The 1-hour picture is considerably harsher, with the relative strength index (RSI) at 27 and Williams at -92 showing a market stretched toward the lower end of its recent range.
The moving averages show exactly where the fight changes character. On the 1-hour chart, bitcoin trades below every listed exponential moving average (EMA) and simple moving average (SMA), including the 200-period exponential moving average (EMA) at $84,851 and 200-period simple moving average (SMA) at $84,808. Daily readings are less severe because bitcoin remains above the 30-, 50-, 100- and 200-period averages.
Defend $83,404 and recover $84,350, and buyers finally have something to work with.
A clean loss of $83,404 would keep the short-term breakdown alive, with $81,950 looming as the next major chart marker and the bulls left searching for firmer ground.
U.S. bitcoin ETFs returned to positive territory Tuesday with $118.86 million in net inflows, led almost entirely by Blackrock’s IBIT.…