This is an excerpt from CoinDesk newsletter 'Daybook.' Sign up here , if you haven't already.
Earlier this week, CoinDesk discussed how risk management in bitcoin is becoming increasingly popular, steadily reducing the the largest cryptocurrency’s volatility and making it more palatable to professional investors.
That raises a question. How does its stability compare with major assets such as gold, its traditional rival, with the S&P 500, the biggest stock index, with the euro-dollar exchange rate, the most liquid fiat currency pair, and with Nvidia NVDA , the largest stock by market value? That comparison matters when deciding whether an asset can diversify a portfolio or increase portfolio volatility risk.
It transpires there is still a long way to go before bitcoin can match the euro-dollar, gold and stock indexes in terms of stability.
That’s according to a widely tracked metric called realized volatility, which measures how much an asset's price has moved over a period, such as 30 or 90 days. The gauge is the standard deviation of daily returns, usually annualized to show what a full year of such moves would look like. The higher the number, the bigger the swings and the stronger the perception that the asset is risky.
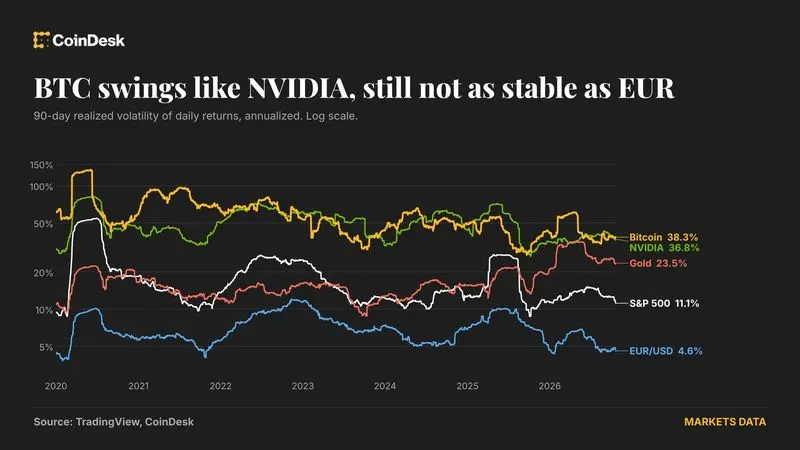
Bitcoin's 90-day realized volatility stood at about 38% as of Thursday, based on CoinDesk's calculations. Its main rival, gold, is at about 23.5%. The S&P 500 sits at about 11%, so bitcoin is a little over three times as jumpy as stocks.
EUR/USD, which matches the euro — the shared currency of 21 countries — against the dollar, the global reserve currency, is the steadiest of all, with a 90-day realized volatility of 4.6%. Bitcoin is roughly eight times as volatile.
The currency pair’s volatility has stayed in single digits despite uncertainty over the French government debt and the resulting recent slide in the euro. Most fiat currency pairs have realized volatility below 10%.
That shows just how much ground BTC, despite its limited-supply feature, has to cover before it can rival traditional medium of exchanges and validate the bitcoin maximalists' view that crypto is better than paper currencies.
The closest match is Nvidia at about 37%. Bitcoin and the AI bellwether now swing by almost the same amount.
The broader improvement in bitcoin, however, is clear. The cryptocurrency’s 90-day volatility has averaged about 58% since January 2020 and peaked at 134% in June 2020. Its calmest reading of 27.5% came in September 2025 when prices rose above $100,000.
So bitcoin has settled down a lot, and it now moves like a big tech stock. But it has yet to rival a national currency. Stay alert!
Read more: For analysis of today's activity in altcoins and derivatives, see Crypto Markets Today . For a comprehensive list of events this week, see CoinDesk's " Crypto Week Ahead ."
The chart on the left shows BVIV, which is Volmex’s 30-day bitcoin implied volatility index, a gauge of options-based expectations for price turbulence in the largest cryptocurrency over four weeks.
On the right is the VIX index, which shows expected volatility in the S&P 500 index.
As of now, the VIX has topped its 200-day moving average, a sign traders are pricing increased uncertainty and wider price swings in the index. On the other hand, BVIV remains below its 200-day average, pointing to expectations for relative stability in the crypto market.
How long bitcoin can defy a potential volatility explosion on Wall Street remains to be seen.
Diversified RWA stablecoins sustain 5-7% yield from real credit as crypto funding compresses to ~4%. GENIUS pushes yield off-chain; TAM grows to $4B in 3 years.